一、ELK 简介
ELK是一个流行的开源日志管理和分析平台,它由三个核心组件组成:Elasticsearch、Logstash和Kibana。这三个组件协同工作,使用户能够收集、存储、搜索、分析和可视化大量日志数据。ELK被广泛用于实时日志分析、应用性能监控、安全事件检测等领域。
下面是每个组件的简要介绍:
Elasticsearch: Elasticsearch是一个开源分布式搜索和分析引擎。它用于存储和索引大量的数据,使用户能够快速进行全文搜索、分析和聚合。Elasticsearch的强大之处在于其分布式性能和可扩展性,它能够处理海量数据并提供高效的查询和分析。
Logstash: Logstash是一个用于收集、处理和转发各种类型数据的数据流处理引擎。它可以从多种来源(如日志文件、消息队列、数据库等)收集数据,经过处理后将数据发送到目标存储(如Elasticsearch)。Logstash可以用于数据清洗、转换、标准化等,以便将数据准备好供后续的搜索和分析。
Kibana: Kibana是一个用于数据可视化和分析的开源工具。它提供了一个用户友好的Web界面,使用户能够创建仪表板、图表和地图来展示Elasticsearch中的数据。通过Kibana,用户可以通过交互式的界面深入分析数据、观察趋势、检测异常等。
ELK的工作流程通常是这样的:Logstash收集和处理各种数据源的日志数据,然后将处理后的数据发送到Elasticsearch进行索引和存储。用户可以使用Kibana来查询数据、创建可视化仪表板,从而更好地理解数据的情况。
需要注意的是,Elasticsearch 在新版本中也被称为 Elastic Stack,因为除了上述三个核心组件外,Elastic 公司还提供了其他一些附加工具和功能,以进一步增强数据分析和管理的能力。
二、Elasticsearch 集群部署
2.1 环境初始化
2.1.1 环境准备
| 主机名 | IP | 系统 | 配置 |
|---|---|---|---|
| elasticsearch-01 | 10.0.0.11 | CentOS 7.6 | 2U 4G |
| elasticsearch-02 | 10.0.0.12 | CentOS 7.6 | 1U 2G |
| elasticsearch-03 | 10.0.0.13 | CentOS 7.6 | 1U 2G |
2.1.2 内核参数及服务调整
# 关闭防火墙
systemctl disable firewalld --now

# 关闭 NetworkManager
systemctl disable NetworkManager --now

# 关闭selinux
setenforce 0
sed -i '/SELINUX/s/enforcing/disabled/' /etc/selinux/config

# 修改文件句柄数的限制
echo "* soft nofile 65536" >> /etc/security/limits.conf
echo "* hard nofile 65536" >> /etc/security/limits.conf
2.1.3 配置 hosts 解析
# cat /etc/hosts
127.0.0.1   localhost localhost.localdomain localhost4 localhost4.localdomain4
::1         localhost localhost.localdomain localhost6 localhost6.localdomain6
10.0.0.11 elasticsearch-01
10.0.0.12 elasticsearch-02
10.0.0.13 elasticsearch-03
2.1.4 安装必要的软件并同步时间
# 安装基础软件
yum install -y epel-release net-tools vim lrzsz tree screen lsof tcpdump wget ntpdate

# 同步时间
cp /usr/share/zoneinfo/Asia/Shanghai /etc/localtime

# 定时同步
echo "*/5 * * * * ntpdate time1.aliyun.com &> /dev/null && hwclock -w" >> /var/spool/cron/root
systemctl restart crond
2.1.5 配置 java 环境
yum install java-1.8.0-openjdk -y
java -version
2.2 安装 elasticsearch
2.2.1 yum 安装 elasticsearch 7.17
Download Elasticsearch | Elastic
[Install Elasticsearch with RPM | Elasticsearch Guide 7.17] | Elastic
rpm --import https://artifacts.elastic.co/GPG-KEY-elasticsearch

cat > /etc/yum.repos.d/elasticsearch-7.repo << EOF
[elasticsearch]
name=Elasticsearch repository for 7.x packages
baseurl=https://artifacts.elastic.co/packages/7.x/yum
gpgcheck=1
gpgkey=https://artifacts.elastic.co/GPG-KEY-elasticsearch
enabled=0
autorefresh=1
type=rpm-md
EOF

yum install -y --enablerepo=elasticsearch elasticsearch
2.2.2 修改配置文件
# cat /etc/elasticsearch/elasticsearch.yml
cluster.name: elk-cluster

node.name: elk-node-01 # 每个节点唯一,根据需要修改

path.data: /apps/elasticsearch/data # 数据存放目录,需要手动创建
path.logs: /apps/elasticsearch/logs

bootstrap.memory_lock: true

network.host: 0.0.0.0

http.port: 9200

discovery.seed_hosts: ["10.0.0.11", "10.0.0.12", "10.0.0.13"]

cluster.initial_master_nodes: ["10.0.0.11", "10.0.0.12", "10.0.0.13"]

gateway.recover_after_nodes: 2

action.destructive_requires_name: true
参数解释
cluster.name: elk-cluster: 设置Elasticsearch集群的名称为"elk-cluster"。node.name: elk-node-01: 设置当前Elasticsearch节点的名称为"elk-node-01"。path.data: /apps/elasticsearch/data和path.logs: /apps/elasticsearch/logs: 分别指定Elasticsearch数据和日志文件的存储路径。bootstrap.memory_lock: true: 这个配置表示Elasticsearch将尝试锁定内存,以提高性能和稳定性。network.host: 0.0.0.0: 允许Elasticsearch绑定到所有可用的网络接口,以允许来自任何IP地址的连接。http.port: 9200: 设置Elasticsearch HTTP服务的监听端口为9200,这是默认的HTTP API端口。discovery.seed_hosts: ["10.0.0.11", "10.0.0.12", "10.0.0.13"]: 指定了Elasticsearch集群的发现节点,这些节点用于启动和发现集群中的其他节点。cluster.initial_master_nodes: ["10.0.0.11", "10.0.0.12", "10.0.0.13"]: 指定了初始的主节点列表,用于初始化集群。gateway.recover_after_nodes: 2: 配置在至少有2个节点可用时才允许集群恢复。action.destructive_requires_name: true: 这个配置要求在执行破坏性操作(如删除索引)时需要提供名称,以防止意外的操作。
2.2.3 修改内存限制
LimitMEMLOCK=infinity是Systemd服务的配置参数之一,用于限制进程的内存锁定(mlock)资源。这个参数的含义是将内存锁定资源的限制设置为无限制,也就是允许进程锁定任意数量的内存。内存锁定是一种操作,用于将内存分配给进程,并防止操作系统将其交换到磁盘上,从而提高了对内存的快速访问。在某些应用程序中,特别是对于需要高性能和低延迟的应用程序,需要将一部分内存锁定,以确保数据始终位于物理内存中,而不会被交换到磁盘上,以减少访问延迟。将
LimitMEMLOCK设置为infinity允许进程锁定所需的内存而不受限制。请注意,修改此设置可能会影响系统的性能和稳定性,因为不受限制的内存锁定可能导致系统资源不足,因此在进行此类配置更改时需要小心谨慎,并确保了解应用程序的内存使用模式和系统资源限制。
此外,上述配置片段通常可以在Systemd服务单元文件(通常位于
/etc/systemd/system/或/lib/systemd/system/中)中找到,并用于调整特定服务的资源限制。具体的配置文件可能因不同的Linux发行版和应用程序而有所不同。
注意:要在Service 块中设置,不然不会生效
# grep LimitMEMLOCK=infinity /usr/lib/systemd/system/elasticsearch.service -B 1
[Service]
LimitMEMLOCK=infinity
# systemctl daemon-reload
修改堆内存大小
[Heap size settings | Elasticsearch Guide 8.9] | Elastic
# grep Xm /etc/elasticsearch/jvm.options
-Xms1g
-Xmx1g
创建数据存放目录
mkdir -p /apps/elasticsearch/{data,logs}
chown -R elasticsearch.elasticsearch /apps/elasticsearch/
2.3 启动服务并查看集群状态
Elasticsearch 集群状态用于表示集群的整体健康状况。Elasticsearch 集群可以处于不同的健康状态,这些状态反映了集群中数据分片的可用性和完整性。以下是 Elasticsearch 集群状态的主要介绍:
- Green(绿色):
- 集群处于最佳状态。
- 所有主分片和复制分片都可用。
- 集群的数据完整性和可用性都非常高。
- 所有节点都正常运行,没有故障。
- 性能正常,没有性能问题。
- Yellow(黄色):
- 集群状态表示为 “yellow” 时,主分片都可用,但复制分片(副本)可能存在问题。
- 可能有一些副本分片尚未分配到节点上,或者某些节点不可用。
- 数据完整性有一定程度的风险,因为复制分片的可用性受到影响。
- 性能通常良好,但需要关注集群健康状态。
- Red(红色):
- 集群状态表示为 “red” 时,意味着主分片不可用。
- 这可能是由于主分片丢失、未分配或者节点故障等问题引起的。
- 数据的可用性和完整性受到严重威胁,因为主分片无法提供数据访问。
- 性能可能会受到影响,具体取决于缺失的主分片数量和查询的性质。
2.3.1 启动服务
# systemctl start elasticsearch
# systemctl status elasticsearch

[root@elasticsearch-01 ~]# ss -ntl
State      Recv-Q Send-Q                     Local Address:Port                                    Peer Address:Port
LISTEN     0      128                                    *:22                                                 *:*
LISTEN     0      100                            127.0.0.1:25                                                 *:*
LISTEN     0      128                                   :::9200   # 服务监听端口                                           :::*
LISTEN     0      128                                   :::9300   # 集群通信端口                                           :::*
LISTEN     0      128                                   :::22                                                :::*
LISTEN     0      100                                  ::1:25                                                :::*

[root@elasticsearch-01 ~]# curl localhost:9200
{
  "name" : "elk-node-01",	# 节点名称
  "cluster_name" : "elk-cluster",
  "cluster_uuid" : "XXO_Ik9XQo2Y5Uw6UvVS-g",
  "version" : {
    "number" : "7.17.13", 	# elasticsearch 版本号
    "build_flavor" : "default",
    "build_type" : "rpm",
    "build_hash" : "2b211dbb8bfdecaf7f5b44d356bdfe54b1050c13",
    "build_date" : "2023-08-31T17:33:19.958690787Z",
    "build_snapshot" : false,
    "lucene_version" : "8.11.1",
    "minimum_wire_compatibility_version" : "6.8.0",
    "minimum_index_compatibility_version" : "6.0.0-beta1"
  },
  "tagline" : "You Know, for Search"	# 宣传语
}
2.3.2 查看集群状态
可以利用此接口对 elasticseach 集群状态进行监控
[root@elasticsearch-01 ~]# curl localhost:9200/_cluster/health?pretty
{
  "cluster_name" : "elk-cluster",
  "status" : "green",	# 集群监控状态
  "timed_out" : false,
  "number_of_nodes" : 3,
  "number_of_data_nodes" : 3,
  "active_primary_shards" : 3,
  "active_shards" : 6,
  "relocating_shards" : 0,
  "initializing_shards" : 0,
  "unassigned_shards" : 0,
  "delayed_unassigned_shards" : 0,
  "number_of_pending_tasks" : 0,
  "number_of_in_flight_fetch" : 0,
  "task_max_waiting_in_queue_millis" : 0,
  "active_shards_percent_as_number" : 100.0
}
以下是其中的一些关键字段的解释:
"cluster_name" : "elk-cluster": 集群的名称,这个示例中的集群名称为 “elk-cluster”。"status" : "green": 集群的健康状态,这个示例中集群状态为 “green”,表示集群处于最佳状态。"number_of_nodes" : 3: 集群中的节点数量,这个示例中有3个节点。"number_of_data_nodes" : 3: 集群中的数据节点数量,这是实际存储数据的节点数,这个示例中也是3个。"active_primary_shards" : 3: 活动主分片的数量,这是集群中主要负责存储数据的分片数量,这个示例中有3个。"active_shards" : 6: 所有活动分片的数量,包括主分片和副本分片,这个示例中有6个。"relocating_shards" : 0: 正在迁移的分片数量,如果你在重新平衡集群或迁移分片,则该值可能会增加。"initializing_shards" : 0: 正在初始化的分片数量,通常在新分片或节点加入时出现。"unassigned_shards" : 0: 未分配的分片数量,这是指尚未分配到任何节点的分片数量。在集群状态为 “green” 时,这应该是0。"delayed_unassigned_shards" : 0: 延迟未分配的分片数量,这是指尚未分配到节点,但由于一些原因而被延迟的分片数量。"number_of_pending_tasks" : 0: 集群中待处理任务的数量,例如索引创建或删除等操作可能会生成待处理任务。"number_of_in_flight_fetch" : 0: 目前正在进行的数据获取请求的数量。"task_max_waiting_in_queue_millis" : 0: 队列中等待的任务的最大等待时间(以毫秒为单位)。"active_shards_percent_as_number" : 100.0: 活动分片的百分比,作为数字表示。在 “green” 状态下,应该是100%,表示所有分片都是活动的。
总的来说,这些信息提供了有关 Elasticsearch 集群状态和性能的关键指标,可以用于监控和管理集群。在 “green” 状态下,集群是健康的,数据完整性和可用性都非常高。
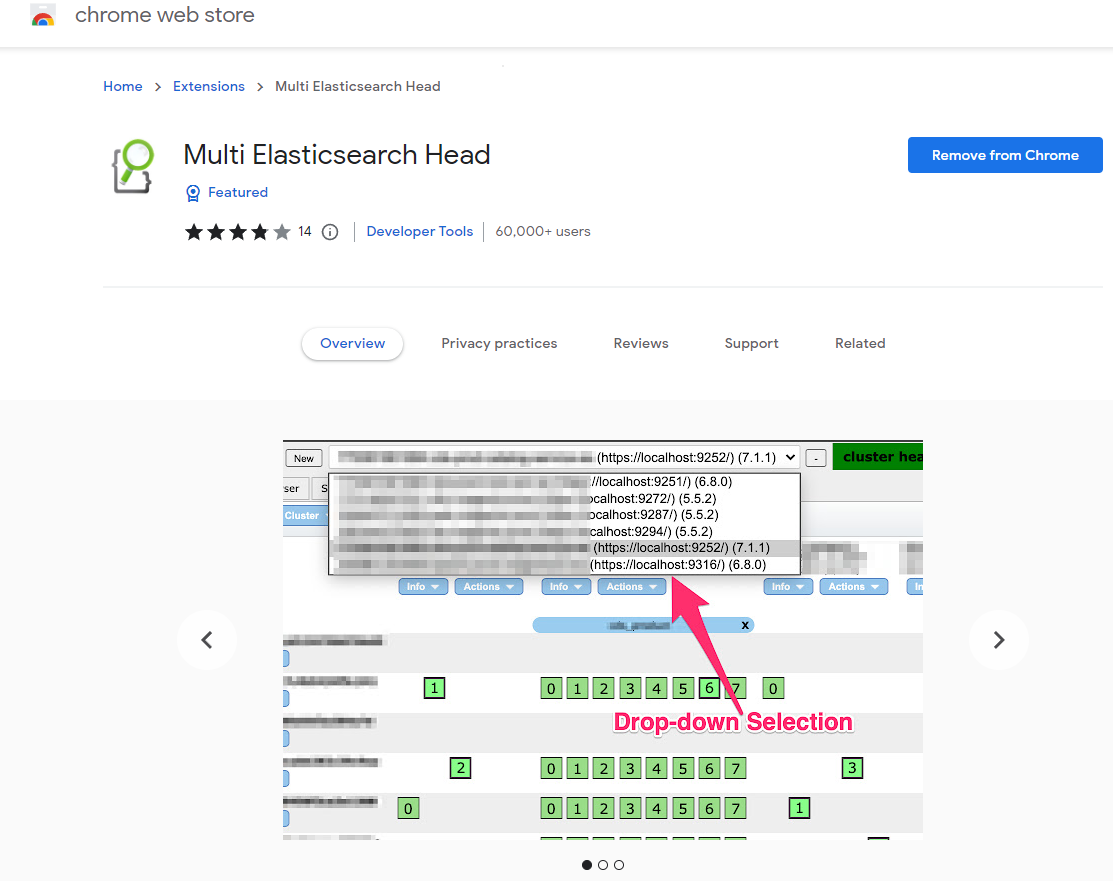
2.3.3 elasticseach 插件
官方提供了一些插件但大部分是收费的,另外也有一些开发爱好者提供的插件,可以实现对 elasticsearch 集群的状态监控与管理配置等功能,Multi Elasticsearch Head 就是其中一个。
可以通过浏览器的应用商店安装 (chrome 、edge)
三、 Logstash 部署
Logstash 是一个开源的数据收集引擎,可以水平伸缩,基于 ruby 开发,而且 logstash 整个 ELK当中拥有最多插件的一个组件,其可以接收来自不同来源的数据并统一输出到指定的且可以是多个不同目的地。
3.1 环境准备
| 主机名 | IP | 系统 | 配置 |
|---|---|---|---|
| logstash | 10.0.0.15 | CentOS 7.6 | 2U 4G |
3.1.2 关闭不需要的服务
# 关闭防火墙
systemctl disable firewalld --now

# 关闭 NetworkManager
systemctl disable NetworkManager --now

# 关闭selinux
setenforce 0
sed -i '/SELINUX/s/enforcing/disabled/' /etc/selinux/config
3.1.2 配置 Java 环境
yum install java-1.8.0-openjdk -y
java -version
3.2 安装 logstash
[Installing Logstash | Logstash Reference 7.17] | Elastic
# 导入证书
rpm --import https://artifacts.elastic.co/GPG-KEY-elasticsearch
# 配置 yum 源
cat > /etc/yum.repos.d/logstash-7.repo << EOF
[logstash-7.x]
name=Elastic repository for 7.x packages
baseurl=https://artifacts.elastic.co/packages/7.x/yum
gpgcheck=1
gpgkey=https://artifacts.elastic.co/GPG-KEY-elasticsearch
enabled=1
autorefresh=1
type=rpm-md
EOF

# 安装并启动服务
yum install -y logstash
systemctl start logstash.service
3.3 logstash 的使用
Logstash 是一个开源的数据收集引擎,可以水平伸缩,而且 logstash 整个 ELK 当中拥有最多插件的一个组件,其可以接收来自不同来源的数据并统一输出到指定的且可以是多个不同目的地。
3.3.1 测试标准输入和标准输出
在Logstash的配置中,“codec” 是"编解码器"(Codec)的缩写。编解码器是一种用于将数据编码成特定格式或从特定格式解码数据的组件。在Logstash中,它用于指定输入和输出的数据格式。
在你提供的配置中,你使用了Elasticsearch输出插件,并指定了"codec"选项为"json"。这表示你希望将Logstash事件数据编码为JSON格式,然后将其发送到Elasticsearch。这有助于确保数据以JSON格式存储在Elasticsearch中,以便后续查询和分析。
“codec"选项的常见值包括:
“json”:将事件数据编码为JSON格式。
“plain”:不对事件数据进行编码,保持原始格式。
“json_lines”:将事件数据编码为一行一条JSON记录的格式。
“multiline”:用于处理多行日志事件。
[root@logstash ~]# /usr/share/logstash/bin/logstash -e 'input{ stdin{} } output{ stdout{ codec=>rubydebug }}'
...
The stdin plugin is now waiting for input:
hello
{
       "message" => "hello",	# 消息内容
          "host" => "logstash",	# 主机名
    "@timestamp" => 2023-09-19T01:16:14.334Z, # 事件发生时间
      "@version" => "1"	# 事件版本号,一个事件就是一个 ruby 对象
}
^C
3.3.2 测试输出到文件
[root@logstash ~]#  /usr/share/logstash/bin/logstash -e 'input { stdin{} } output{ file { path => "/tmp/log-%{+YYYY.MM.dd}.txt"}}'
...
The stdin plugin is now waiting for input:
[INFO ] 2023-09-19 09:30:28.836 [Agent thread] agent - Pipelines running {:count=>1, :running_pipelines=>[:main], :non_running_pipelines=>[]}
hello
world
^C
# 输出文本文件
[root@logstash ~]# file /tmp/log-2023.09.19.txt
/tmp/log-2023.09.19.txt: ASCII text

# 消息内容已输出到文本中,多条消息会追加到文件末尾
[root@logstash ~]# cat /tmp/log-2023.09.19.txt
{"message":"hello","@version":"1","@timestamp":"2023-09-19T01:30:40.576Z","host":"logstash"}
{"message":"world","host":"logstash","@version":"1","@timestamp":"2023-09-19T01:33:12.308Z"}
3.3.3 测试输出到 elasticsearch
[root@logstash ~]# /usr/share/logstash/bin/logstash -e 'input { stdin{} } output{ elasticsearch {hosts => ["10.0.0.11:9200"] index =>"mytest-%{+YYYY.MM.dd}" }}'
...
WARNING: All illegal access operations will be denied in a future release
[INFO ] 2023-09-19 10:07:09.728 [[main]-pipeline-manager] javapipeline - Pipeline started {"pipeline.id"=>"main"}
[INFO ] 2023-09-19 10:07:09.770 [Agent thread] agent - Pipelines running {:count=>1, :running_pipelines=>[:main], :non_running_pipelines=>[]}
The stdin plugin is now waiting for input:
hello world!
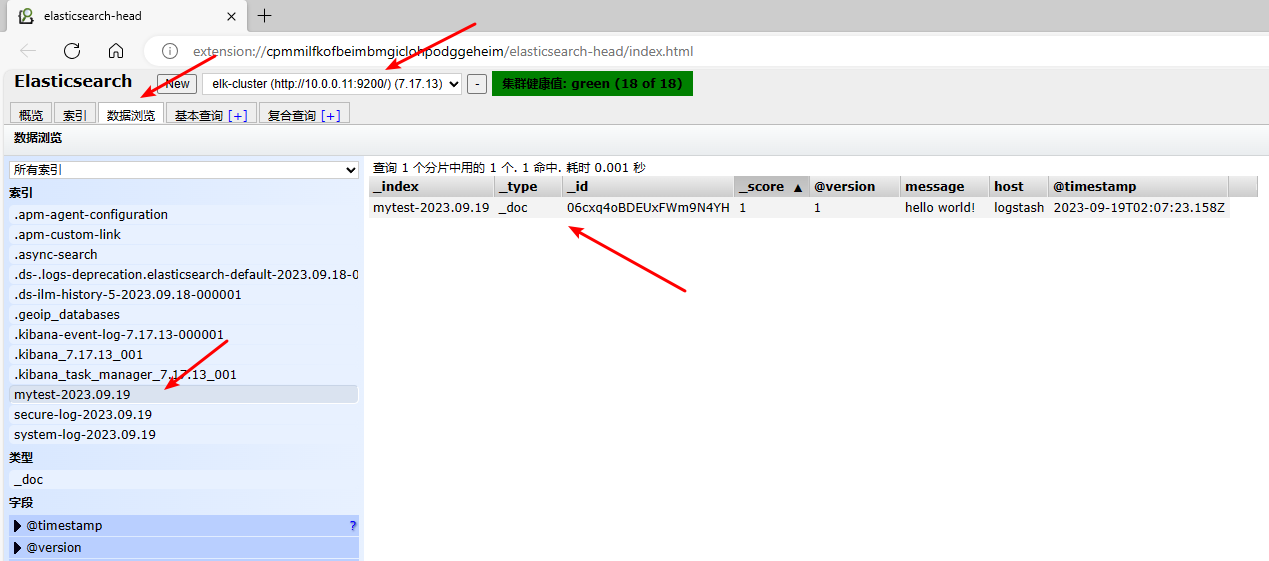
在 elasticsearch-01 查看索引
[root@elasticsearch-01 ~]# curl -s -XGET "http://localhost:9200/_cat/indices?v" | grep mytest
green  open   mytest-2023.09.19                qti_NT1sRNyBWrJY-T27zg   1   1          1            0     10.8kb          5.4kb
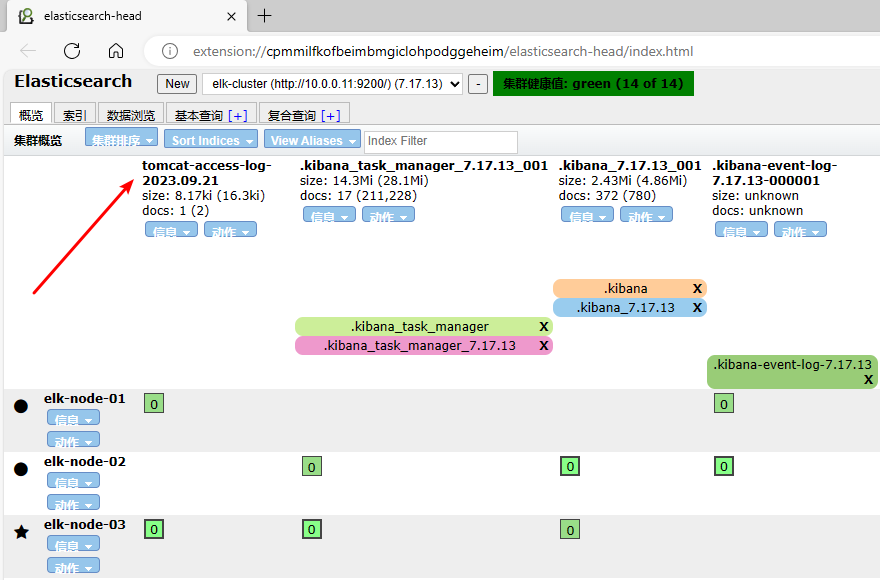
使用 head 插件 查看
四、Kibana 部署
Kibana 是一款开源的数据分析和可视化平台,它是 Elastic Stack 成员之一,基于 TypeScript 语言开发,设计用于和 Elasticsearch 协作,可以使用 Kibana 对 Elasticsearch 索引中的数据进行搜索、查看、交互操作, 你可以很方便的利用图表、表格及地图对数据进行多元化的分析和呈现。
Kibana 可以使大数据通俗易懂。它很简单,基于浏览器的界面便于你快速创建和分享动态数据仪表板来追踪 Elasticsearch 的实时数据变化。
4.1 环境准备
| 主机名 | IP | 系统 | 配置 |
|---|---|---|---|
| kibana | 10.0.0.16 | CentOS 7.6 | 1U 2G |
# 关闭防火墙
systemctl disable firewalld --now

# 关闭 NetworkManager
systemctl disable NetworkManager --now

# 关闭selinux
setenforce 0
sed -i '/SELINUX/s/enforcing/disabled/' /etc/selinux/config
4.2 安装kibana
[Install Kibana | Kibana Guide 7.17] | Elastic
[Install Kibana with RPM | Kibana Guide 7.17] | Elastic
rpm --import https://artifacts.elastic.co/GPG-KEY-elasticsearch

cat > /etc/yum.repos.d/kibana-7.repo << EOF
[kibana-7.x]
name=Kibana repository for 7.x packages
baseurl=https://artifacts.elastic.co/packages/7.x/yum
gpgcheck=1
gpgkey=https://artifacts.elastic.co/GPG-KEY-elasticsearch
enabled=1
autorefresh=1
type=rpm-md
EOF

yum install -y kibana
4.3 启动服务并验证
# 修改配置文件
[root@kibana ~]# cat /etc/kibana/kibana.yml
server.port: 5601
server.host: "0.0.0.0"
elasticsearch.hosts: ["http://10.0.0.11:9200"]

# 启动服务
[root@kibana ~]# systemctl start kibana

# 验证端口及服务状态
[root@kibana ~]# ss -ntl|grep 5601
LISTEN     0      128          *:5601                     *:*
[root@kibana ~]# curl localhost:5601/status -I
HTTP/1.1 200 OK
x-content-type-options: nosniff
referrer-policy: no-referrer-when-downgrade
content-security-policy: script-src 'unsafe-eval' 'self'; worker-src blob: 'self'; style-src 'unsafe-inline' 'self'
kbn-name: kibana
kbn-license-sig: 476866a5c1f8dfa58158ed8c49315635554443bf0f3ae73994b5dfac2c777125
content-type: text/html; charset=utf-8
cache-control: private, no-cache, no-store, must-revalidate
content-length: 144960
vary: accept-encoding
Date: Tue, 19 Sep 2023 03:14:15 GMT
Connection: keep-alive
Keep-Alive: timeout=120
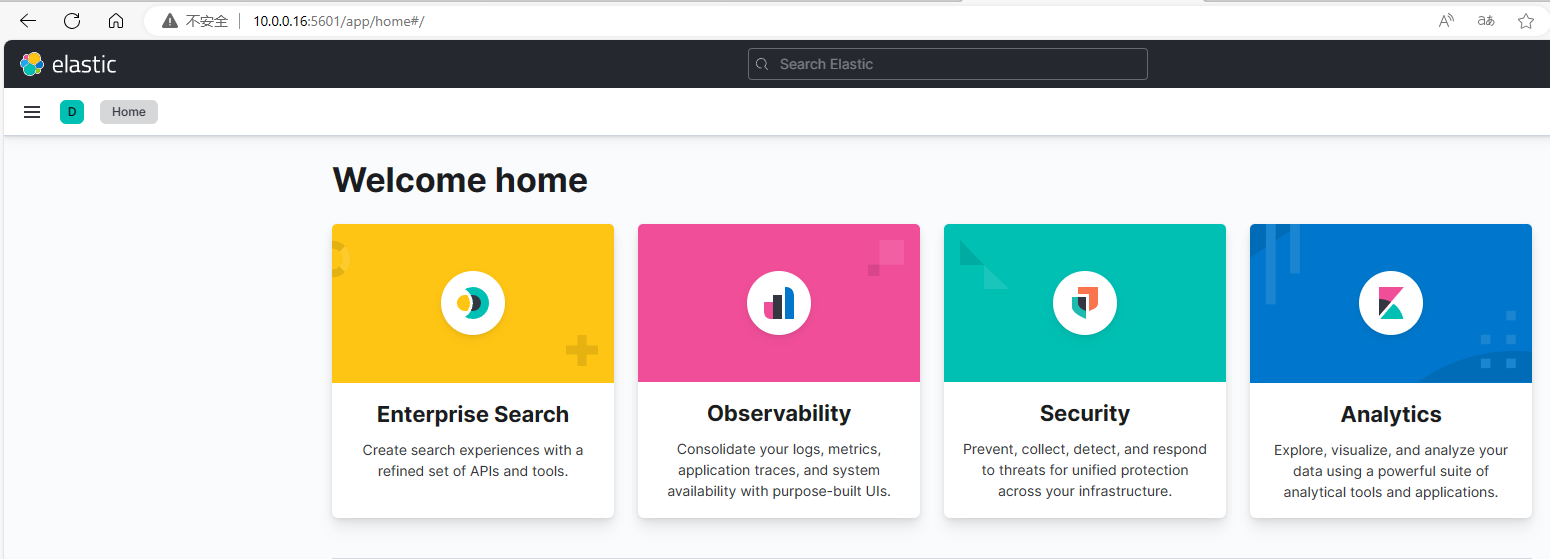
服务启动成功后即可通过浏览器登录 kibana 管理索引并查看日志了
访问方式:http://10.0.0.16:5601/
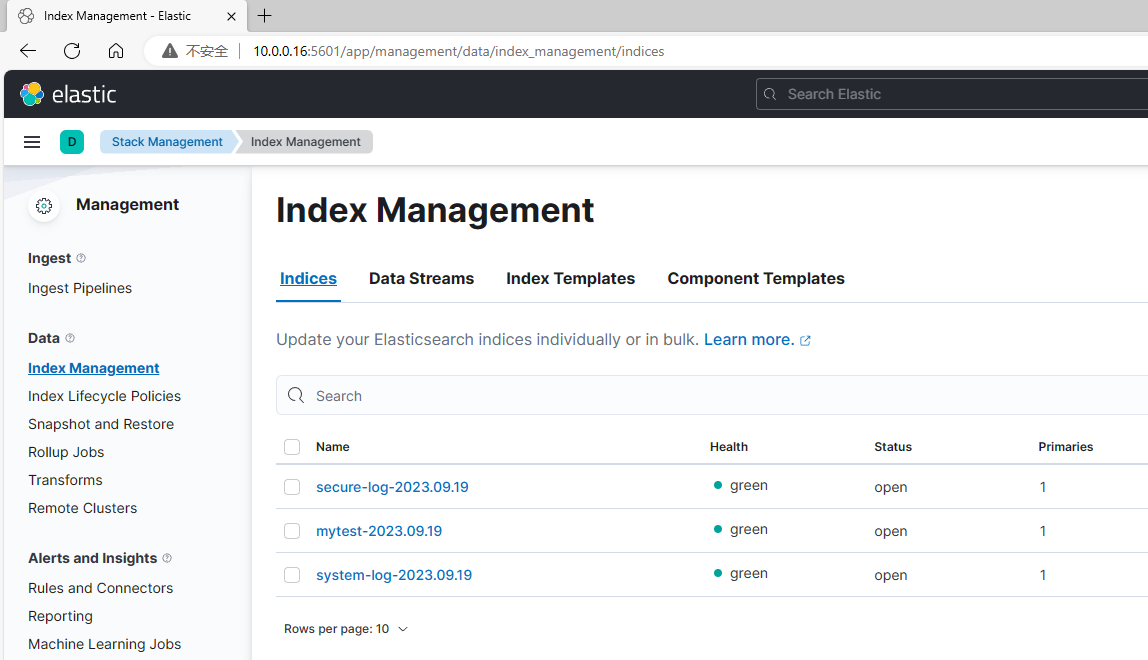
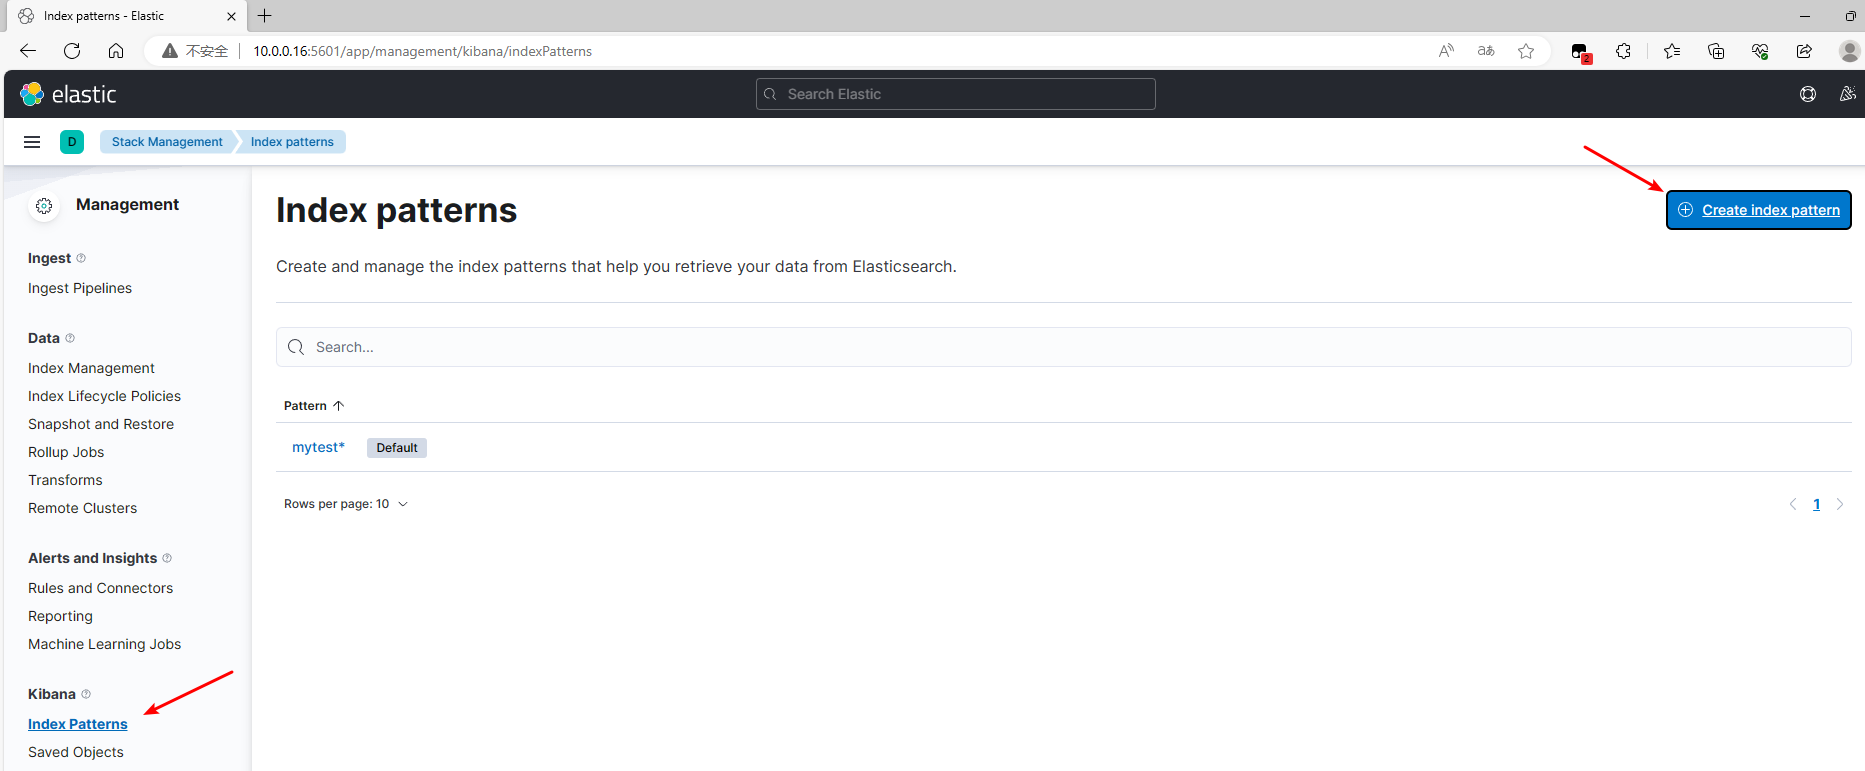
可以在 Stack Management –> Index Management 查看到已添加的索引,也可以在 Index pattern 添加索引模式,方便后续在 Discover 界面查看。
五、Logstash 收集日志
5.1 收集单个日志
注意:logstash 默认以 logstash 用户启动,因为需要保证 logstash 用户对日志文件有对应的权限
5.1.1 准备配置文件:
[root@logstash ~]# cat /etc/logstash/conf.d/system-log.conf
input {
  file {
    path => "/var/log/messages" # 日志路径
    type => "system-log" # 事件的唯一类型
    start_position => "beginning" # 第一次收集日志的位置
    stat_interval => "3" # 日志收集的间隔时间
  }
}

output {
  file {
    path => "/tmp/%{type}-%{+YYYY.MM.dd}.log"
  }
}
5.1.2 修改日志文件权限
[root@logstash ~]# chmod 644 /var/log/messages
5.1.3 修改校验文件语法
[root@logstash ~]# /usr/share/logstash/bin/logstash -f /etc/logstash/conf.d/system-log.conf -t
...
. Config Validation Result: OK. Exiting Logstash # 语法校验通过
5.1.4 重启 logstash 验证结果
# 写入一行日志
[root@logstash ~]# echo "test" >> /var/log/messages

# 成功获取收集到日志信息
[root@logstash ~]# grep test /tmp/system-log-2023.09.19.log
{"@version":"1","host":"logstash","type":"system-log","@timestamp":"2023-09-19T07:02:14.221Z","path":"/var/log/messages","message":"test"}
5.2 收集多个日志
5.2.1 准备配置文件
[root@logstash ~]# cat /etc/logstash/conf.d/system-log.conf
input {
  file {
    path => "/var/log/messages"
    type => "system-log"
    start_position => "beginning"
    stat_interval => "3"
  }
  file {
    path => "/var/log/secure"
    type => "secure-log"
    start_position => "beginning"
    stat_interval => "3"
  }
}

output {
  if [type] == "system-log" {
    elasticsearch {
      hosts=>["10.0.0.11:9200"]
      index=>"%{type}-%{+YYYY.MM.dd}"
    }
  }
  if [type] == "secure-log" {
    elasticsearch {
      hosts=>["10.0.0.11:9200"]
      index=>"%{type}-%{+YYYY.MM.dd}"
     }
  }
}
5.2.2 修改日志文件权限
[root@logstash ~]# chmod 644 /var/log/{messages,secure}
5.2.3 校验语法并重启服务
[root@logstash ~]# /usr/share/logstash/bin/logstash -f /etc/logstash/conf.d/system-log.conf -t
...
. Config Validation Result: OK. Exiting Logstash
5.2.4 在 elasticsearch 查看索引
[root@elasticsearch-01 ~]# curl -s -XGET "http://localhost:9200/_cat/indices?v" | grep  log
green  open   secure-log-2023.09.19            fQpud23vSVC7cpFPCITzbw   1   1          2            0     18.3kb          9.1kb
green  open   system-log-2023.09.19            SeqTjpl-SU-n7uXUmmBBKA   1   1         40            0     44.8kb         22.4kb
5.3 在 kibana 查看索引
5.3.1 查看已有索引
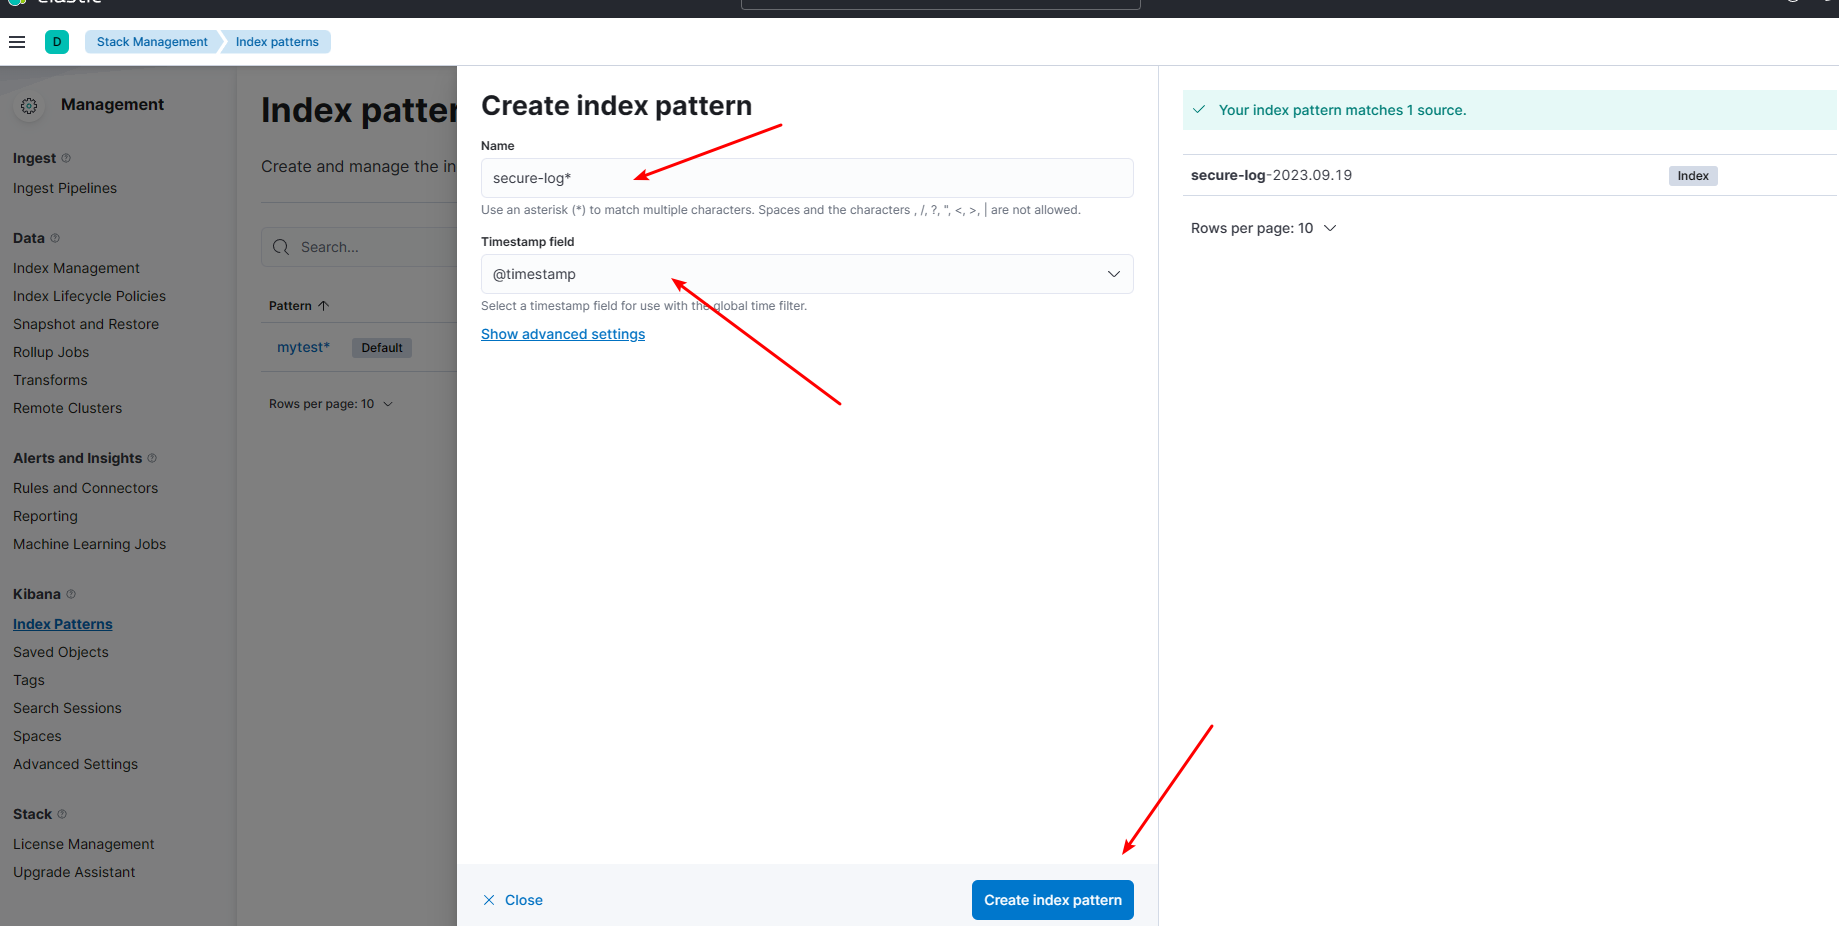
5.3.2 添加索引模式
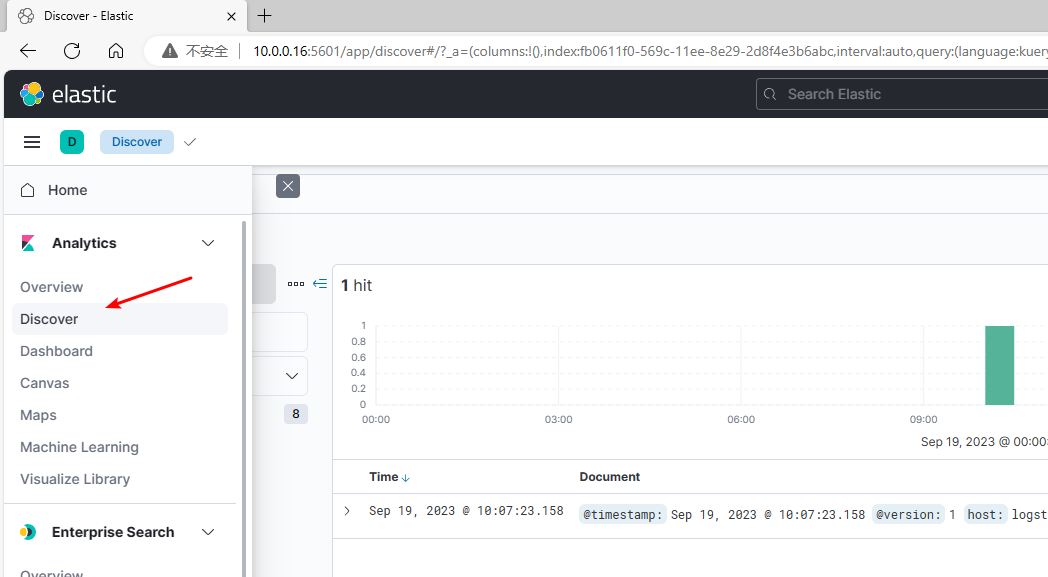
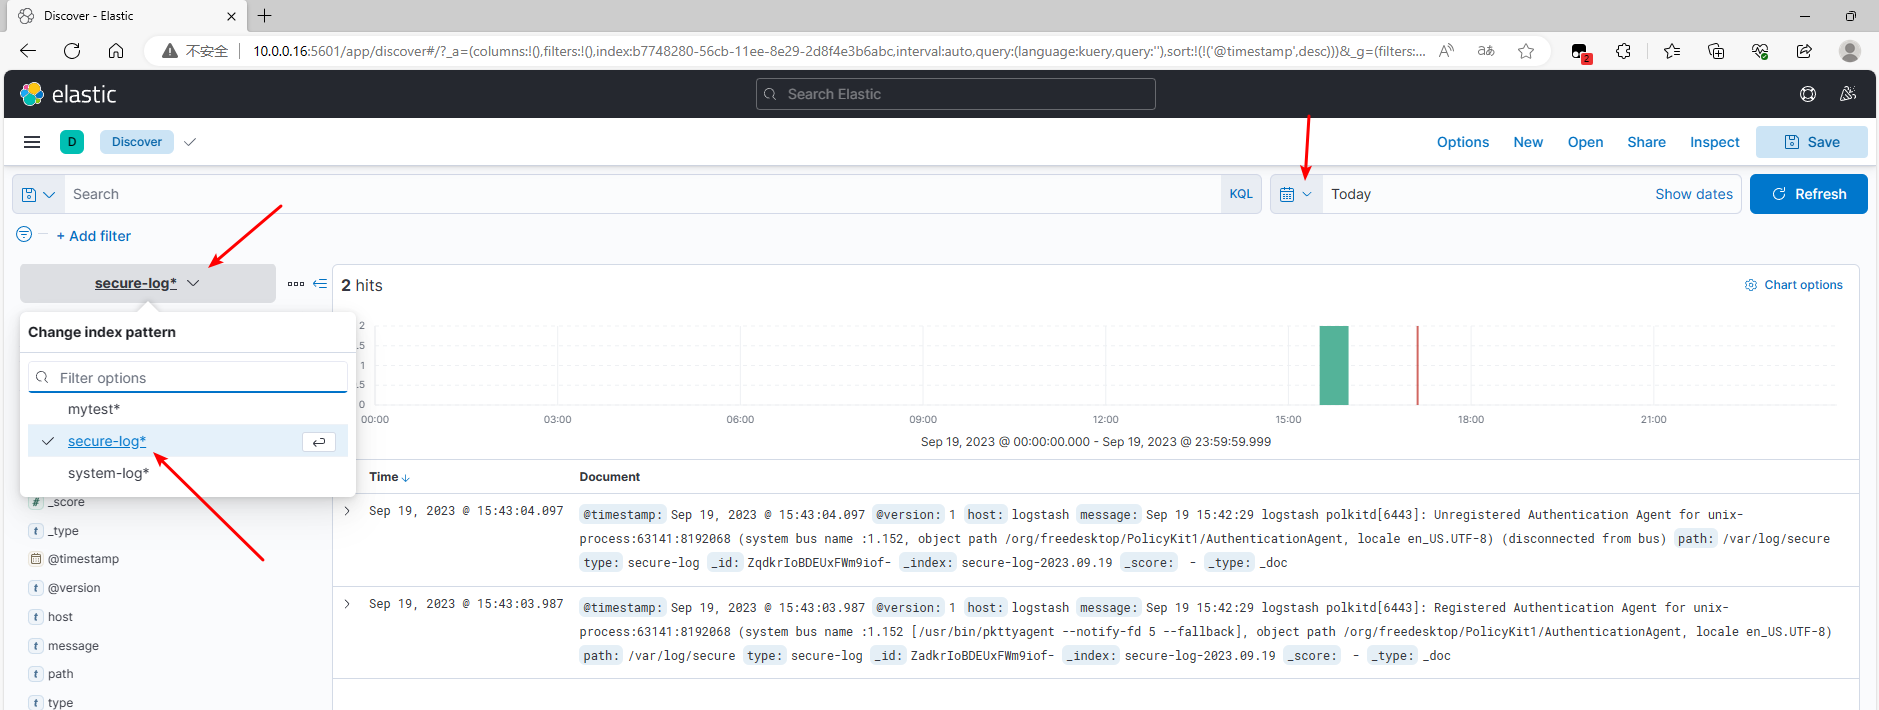
5.3.3 查看结果
5.4 收集 Tomcat 日志
5.4.1 在 logstash 安装tomcat
yum install -y tomcat
5.4.2 配置 tomcat 日志格式为 json 格式
# 修改 pattern 为 json 格式
[root@kibana ~]# grep -A 2 localhost_access_log /etc/tomcat/server.xml
prefix="localhost_access_log." suffix=".txt"
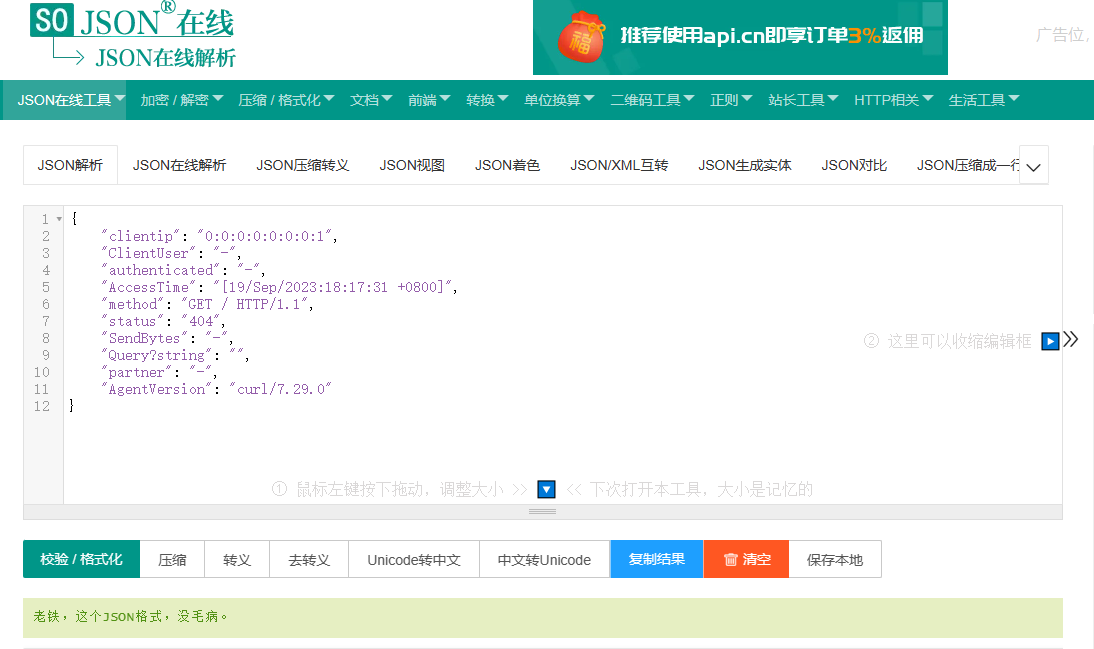
pattern="{"clientip":"%h","ClientUser":"%l","authenticated":"%u","AccessTime":"%t","method":"%r","status":"%s","SendBytes":"%b","Query?string":"%q","partner":"%{Referer}i","AgentVersion":"%{User-Agent}i"}"/>
重启服务并验证 tomcat 日志格式
[root@kibana ~]# systemctl start tomcat

# 生成日志
[root@kibana ~]# curl localhost:8080

# 成功将日志修改为 json 格式
[root@kibana ~]# tail /var/log/tomcat/localhost_access_log.2023-09-19.txt
{"clientip":"0:0:0:0:0:0:0:1","ClientUser":"-","authenticated":"-","AccessTime":"[19/Sep/2023:18:17:31 +0800]","method":"GET / HTTP/1.1","status":"404","SendBytes":"-","Query?string":"","partner":"-","AgentVersion":"curl/7.29.0"}
可以通过 JSON在线 | JSON解析格式化—SO JSON在线工具 校验日志格式
5.4.3 准备配置文件
input {
  file {
    path => "/var/log/tomcat/localhost_access_log.*.txt"
    type => "tomcat-access-log"
    start_position => "end"
    stat_interval => "3"
    codec=> "json"
  }
}

output {
  if [type] == "tomcat-access-log" {
    elasticsearch {
      hosts=>["10.0.0.11:9200"]
      index=>"%{type}-%{+YYYY.MM.dd}"
    }
  }
}
5.4.4 重启服务并生成日志
[root@logstash ~]# chmod +x /var/log/tomcat/
[root@logstash ~]# systemctl restart logstash
[root@logstash ~]# curl localhost:8080
5.4.5 查看日志收集结果
5.5 收集 Java 日志
本节内容主要介绍 multiline 插件实现多行匹配,这是一个可以将多行进行合并的插件。有些情况下,Java 应用的日志会很长,在日志文件中以多行的方式呈现,因此需要用此插件来进行多行合并以保证日志的完整性和可读性,所以本节内容的操作是可选的而非必须的。
[Multiline codec plugin | Logstash Reference 8.10] | Elastic
5.5.1 在 elasticsearch-01 安装 logstash
这里是直接取用 elasticsearch-01的 java 日志进行演示,因此安装了 logstash
# 导入证书
rpm --import https://artifacts.elastic.co/GPG-KEY-elasticsearch
# 配置 yum 源
cat > /etc/yum.repos.d/logstash-7.repo << EOF
[logstash-7.x]
name=Elastic repository for 7.x packages
baseurl=https://artifacts.elastic.co/packages/7.x/yum
gpgcheck=1
gpgkey=https://artifacts.elastic.co/GPG-KEY-elasticsearch
enabled=1
autorefresh=1
type=rpm-md
EOF

# 安装并启动服务
yum install -y logstash
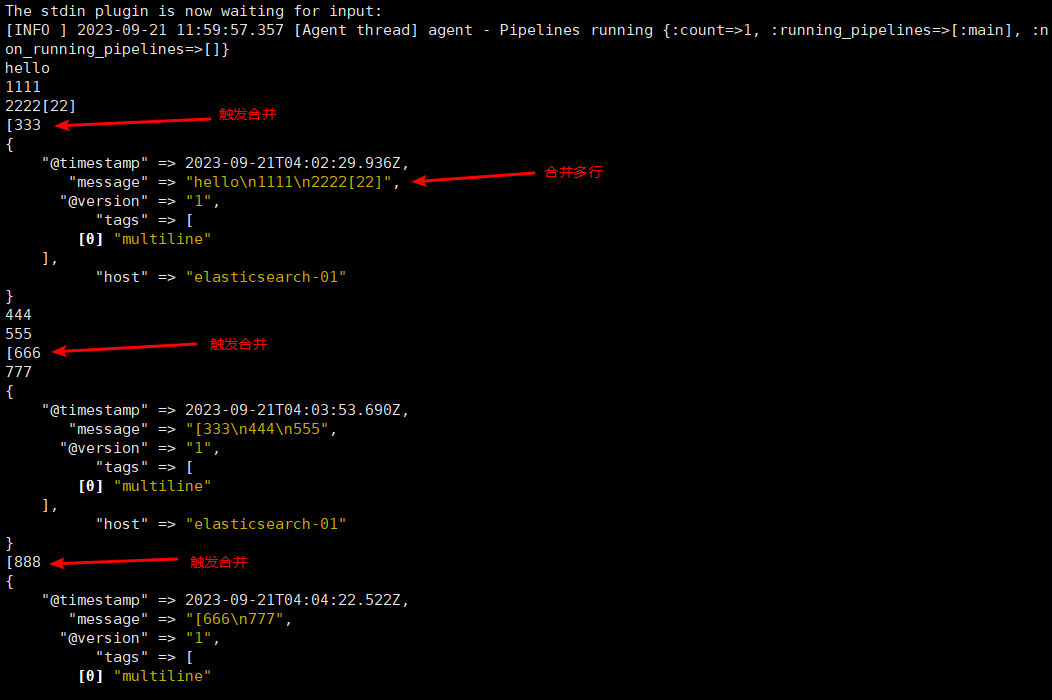
5.5.2 测试多行合并效果
5.5.2.1 准备配置文件
[root@elasticsearch-01 ~]# cat /etc/logstash/conf.d/test.conf
input {
  stdin {
    codec => multiline {
      pattern => "^\[" 	 # 当遇到[开头的行时候将多行进行合并
      negate => true 	 # true 为匹配成功进行操作,false 为不成功进行操作
      what => "previous" # 与以前的行合并,如果是下面的行合并就是 next
    }
  }
}

filter { #日志过滤,如果所有的日志都过滤就写这里,如果只针对某一个过滤就写在 input 里面的日志输入里面
}

output {
  stdout {
    codec => rubydebug
  }
}
5.5.5.2 检查配置
/usr/share/logstash/bin/logstash -f /etc/logstash/conf.d/test.conf -t
...
 which may change in a future major release of Logstash. To avoid unexpected changes when upgrading Logstash, please explicitly declare your desired ECS Compatibility mode.
Configuration OK
5.5.5.3 使用标准输出进行验证
[root@elasticsearch-01 ~]# /usr/share/logstash/bin/logstash -f /etc/logstash/conf.d/test.conf
Using bundled JDK: /usr/share/logstash/jdk
...
[INFO ] 2023-09-21 11:59:55.717 [[main]-pipeline-manager] javapipeline - Pipeline started {"pipeline.id"=>"main"}
The stdin plugin is now waiting for input:
5.5.3 收集 Java 日志
5.5.3.1 准备配置文件
[root@elasticsearch-01 ~]# cat /etc/logstash/conf.d/java.conf
input {
  file {
    path => "/apps/elasticsearch/logs/elk-cluster.log"
    type => "java-log"
    start_position => "beginning"
    codec => multiline {
      pattern => "^\["
      negate => true
      what => "previous"
    }
  }
}
output {
  if [type] == "java-log" {
    elasticsearch {
      hosts => ["10.0.0.11:9200"]
      index=>"%{type}-%{+YYYY.MM.dd}"
    }
  }
}
5.5.3.2 生成 Java 日志文件
重启节点elasticsearch-02,使得集群产生多行错误日志以观察多行合并和的效果
[root@elasticsearch-02 ~]# systemctl restart elasticsearch.service
生成的部分错误日志:
less /apps/elasticsearch/logs/elk-cluster.log
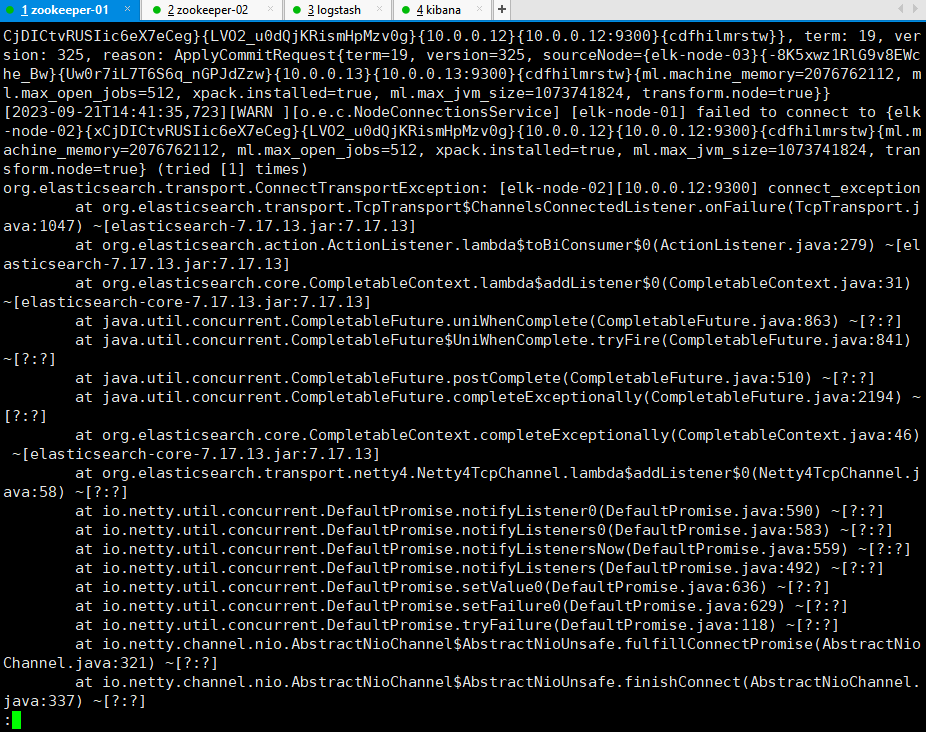
5.5.3.3 成功收集日志
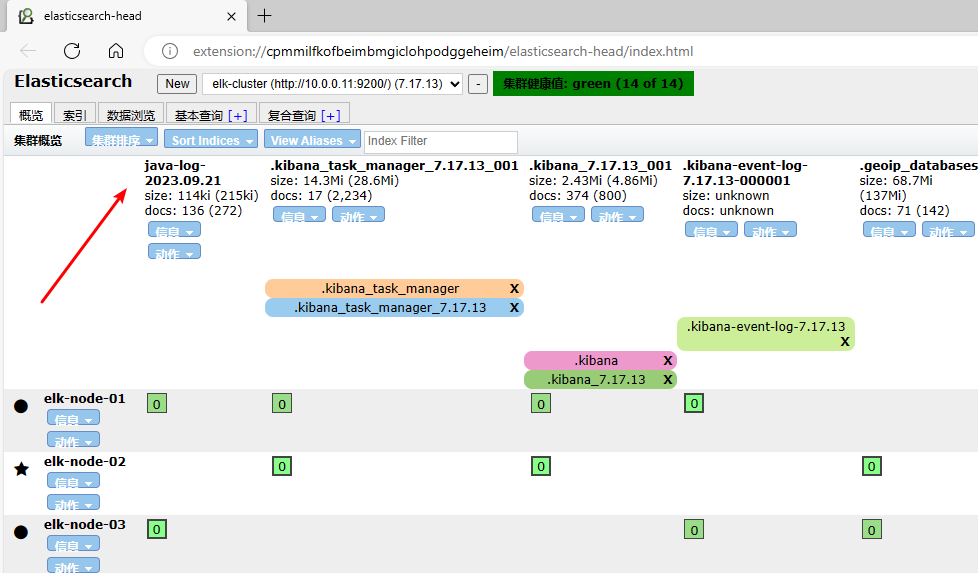
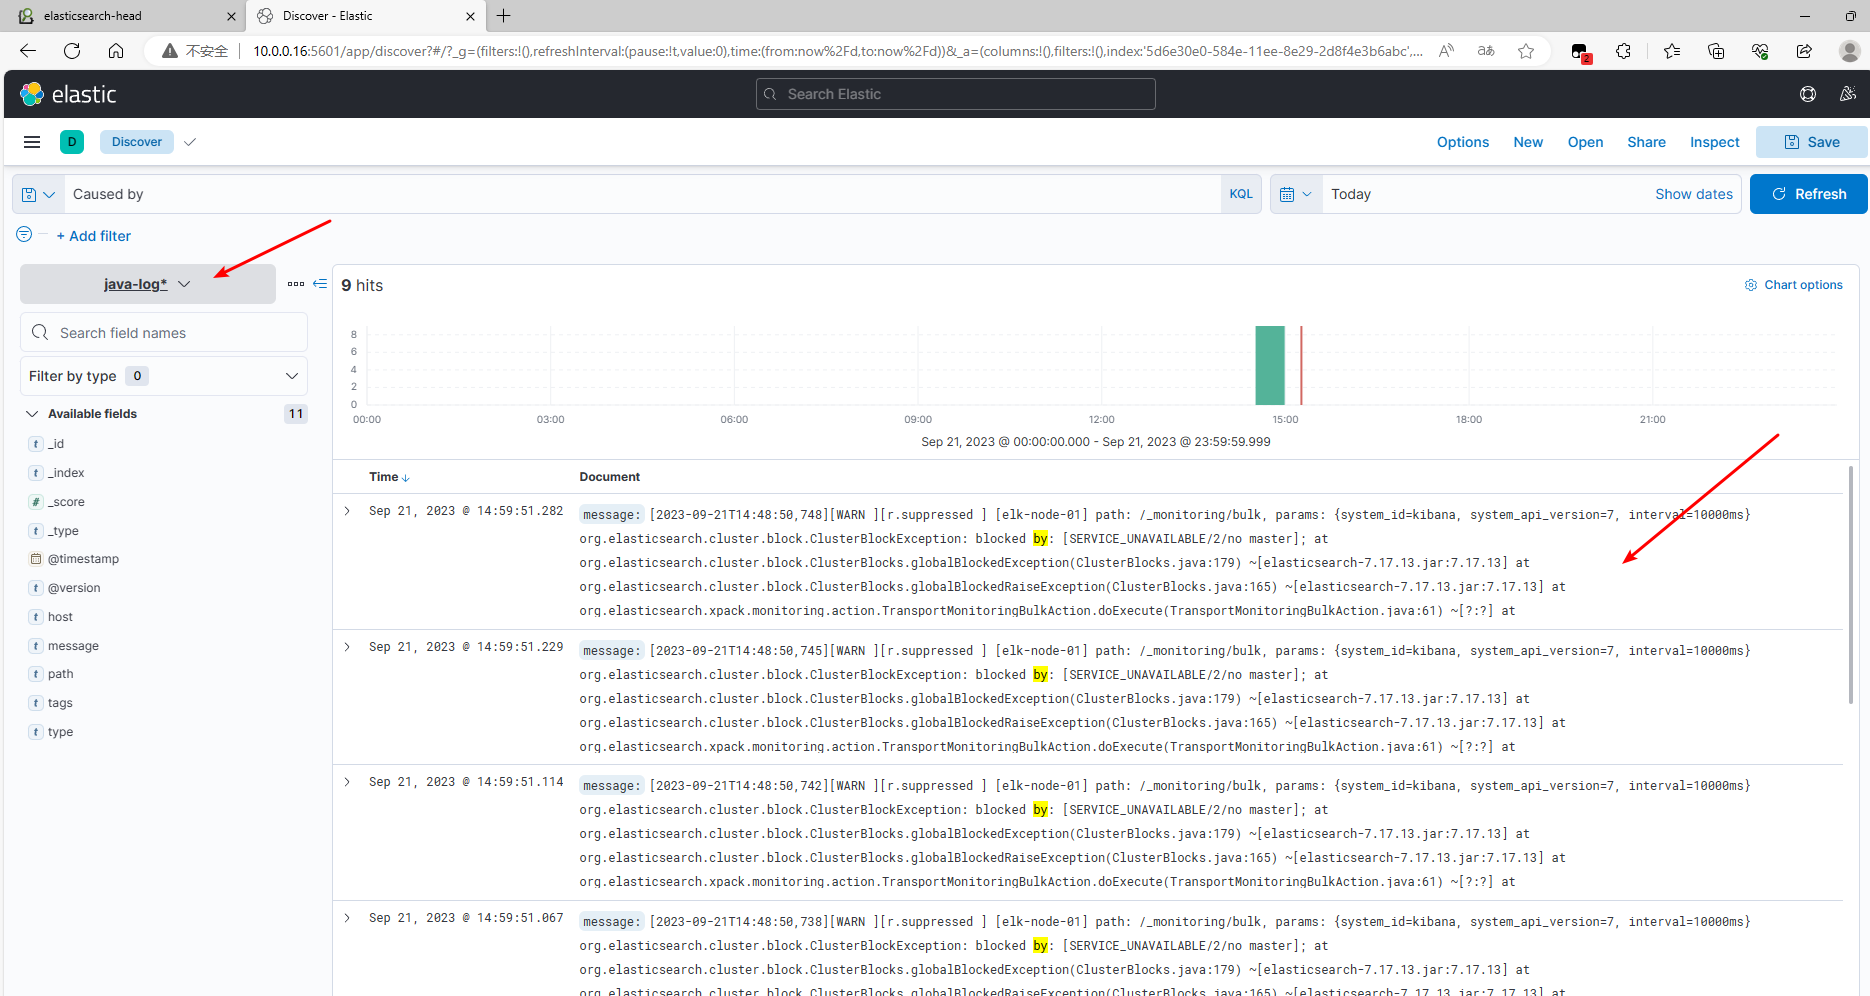
5.5.3.4 通过 kibana 查看结果
添加索引模式 java-log* 后在 Discover 面板查看合并后的日志
5.6 收集 Nginx 日志
nginx 的日志收集和 Java 类似,核心点在于将日志格式修改为 json 格式,这里仅演示如何修改日志格式。
在 logstash 安装 nginx
[root@logstash ~]# yum install -y nginx
修改 nginx 日志为 json 格式
[root@logstash ~]# grep log_format -A 13 /etc/nginx/nginx.conf
    log_format  main  '{"@timestamp":"$time_iso8601",'
		      '"host":"$server_addr",'
		      '"clientip":"$remote_addr",'
		      '"size":$body_bytes_sent,'
		      '"responsetime":$request_time,'
		      '"upstreamtime":"$upstream_response_time",'
		      '"upstreamhost":"$upstream_addr",'
		      '"http_host":"$host",'
		      '"url":"$uri",'
		      '"domain":"$host",'
		      '"xff":"$http_x_forwarded_for",'
		      '"referer":"$http_referer",'
		      '"status":"$status"}';
重启 nginx 生成日志
[root@logstash ~]# systemctl start nginx
[root@logstash ~]# curl localhost
[root@logstash ~]# tail /var/log/nginx/access.log
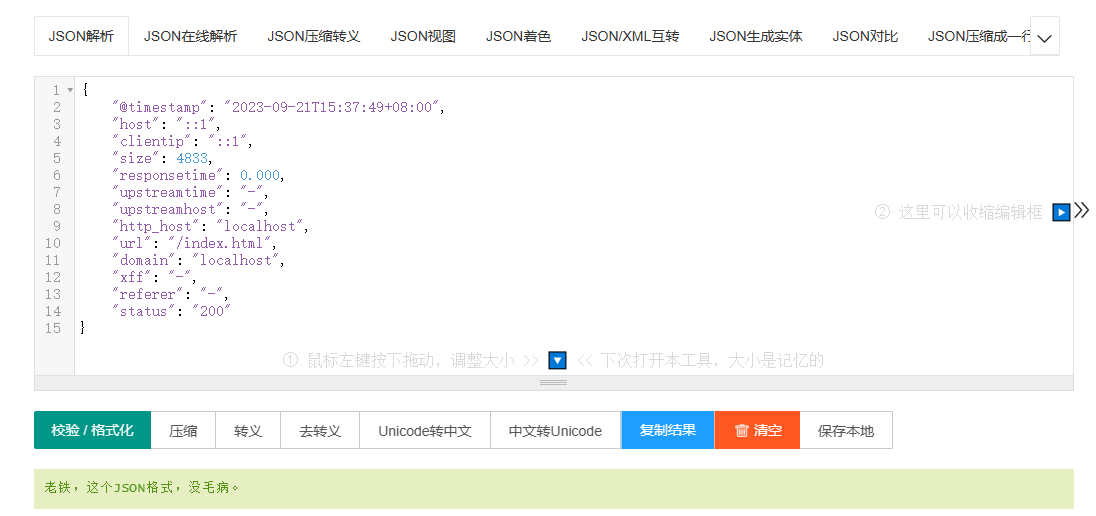
{"@timestamp":"2023-09-21T15:37:49+08:00","host":"::1","clientip":"::1","size":4833,"responsetime":0.000,"upstreamtime":"-","upstreamhost":"-","http_host":"localhost","url":"/index.html","domain":"localhost","xff":"-","referer":"-","status":"200"}
校验日志格式 JSON在线 | JSON解析格式化—SO JSON在线工具
5.7 使用 Redis 缓存日志
目标:通过在 redis 客户端部署的 logstash (主机名 log-client) 收集日志,写入 redis (缓存作用),再通过专门的一台 logstash(主机名 logstash)读取 redis 中的日志写入 elasticsearch。
5.7.1 准备一个客户端服务器
| 主机名 | IP | 系统 | 配置 |
|---|---|---|---|
| log-client | 10.0.0.9 | CentOS 7.6 | 2U 4G |
# 关闭防火墙
systemctl disable firewalld --now

# 关闭 NetworkManager
systemctl disable NetworkManager --now

# 关闭selinux
setenforce 0
sed -i '/SELINUX/s/enforcing/disabled/' /etc/selinux/config

# 修改文件句柄数的限制
echo "* soft nofile 65536" >> /etc/security/limits.conf
echo "* hard nofile 65536" >> /etc/security/limits.conf
安装 redis
[root@log-client ~]# yum install -y redis

# 修改配置文件
[root@log-client ~]# cat /etc/redis.conf
bind 0.0.0.0
protected-mode yes
port 6379
tcp-backlog 511
timeout 0
tcp-keepalive 300
daemonize yes
supervised no
pidfile /var/run/redis_6379.pid
loglevel notice
databases 16
requirepass passwd

[root@log-client ~]# systemctl start redis

## 安装 logstash
[root@log-client ~]# # 导入证书
[root@log-client ~]# rpm --import https://artifacts.elastic.co/GPG-KEY-elasticsearch
[root@log-client ~]# # 配置 yum 源
[root@log-client ~]# cat > /etc/yum.repos.d/logstash-7.repo << EOF
> [logstash-7.x]
> name=Elastic repository for 7.x packages
> baseurl=https://artifacts.elastic.co/packages/7.x/yum
> gpgcheck=1
> gpgkey=https://artifacts.elastic.co/GPG-KEY-elasticsearch
> enabled=1
> autorefresh=1
> type=rpm-md
> EOF
[root@log-client ~]# yum install -y logstash
5.7.2 收集日志写入 redis
[root@log-client ~]# cat /etc/logstash/conf.d/sys-to-redis.conf
input {
  file {
    path => "/var/log/message"
    type => "system-log"
    start_position => "beginning"
    stat_interval => "2"
  }
}
output {
  if [type] == "system-log" {
    redis {
      data_type => "list"
      key => "system-log"
      host => "10.0.0.9"
      port => "6379"
      db => "0"
      password => "passwd"
    }
  }
}

root@log-client ~]# chmod +r /var/log/messages
[root@log-client ~]# ll /var/log/messages
-rw-r--r--. 1 root root 596944 Sep 22 11:39 /var/log/messages

[root@log-client ~]# systemctl start logstash.service

# 成功写入日志
[root@log-client ~]# telnet localhost 6379
...
Escape character is '^]'.
auth passwd
+OK
select 0
+OK
keys *
*1
$10
system-log # 以list 方式存储

LRANGE system-log 0 0   #查看其中一条消息
*1
$139
{"path":"/var/log/messages","host":"log-client","@timestamp":"2023-09-22T03:52:48.547Z","type":"system-log","@version":"1","message":"tet"}
5.7.3 读取 redis 的日志写入 elasticsearch
准备配置文件:
[root@logstash ~]# cat /etc/logstash/conf.d/redis-to-es.conf
input {
  redis {
    data_type => "list"
    key => "system-log"
    host => "10.0.0.9"
    port => "6379"
    db => "0"
    password => "passwd"
  }
}
output {
  if [type] == "system-log" {
    elasticsearch {
      hosts => ["10.0.0.11:9200"]
      index => "redis-to-es-%{+YYYY.MM.dd}"
    }
  }
}

# 重启logstash
[root@logstash ~]# systemctl restart logstash
验证结果:
elasticseach 成功获取到日志信息
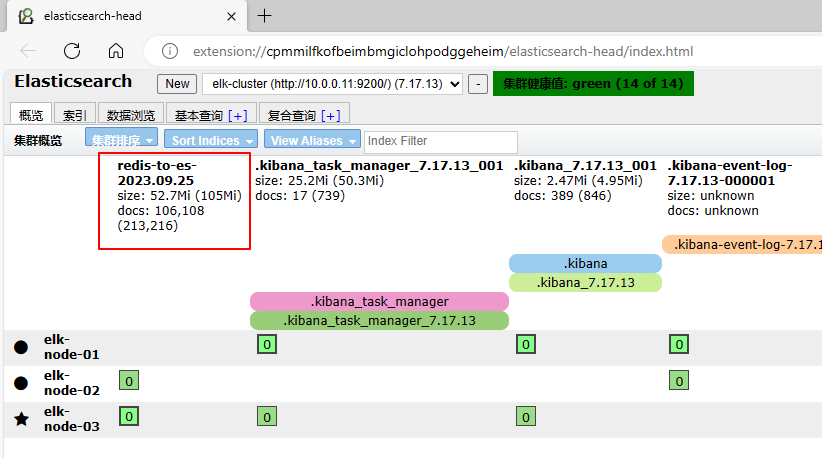
redis 中的消息被消费:
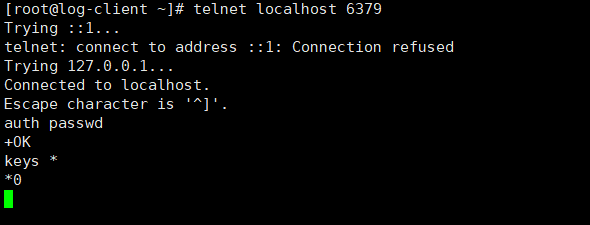
5.8 使用 Kafka 缓存日志
5.8.1 在 log-clinet 部署 kafka
Kafka简介与集群部署 | WZ’s Blog (senmer.github.io)
5.8.2 将日志写入 Kafka
[root@log-client ~]# cat /etc/logstash/conf.d/sys-to-kafka.conf
input {
  file {
    path => "/var/log/messages"
    type => "system-log"
    start_position => "beginning"
    stat_interval => "2"
  }
}
output {
  if [type] == "system-log" {
    kafka {
      bootstrap_servers => "10.0.0.11:9092"
      topic_id => "system-log"
    }
  }
}

# 配置域名解析,kafka 连接 elasticsearch 需要用到
[root@log-client ~]# cat /etc/hosts
127.0.0.1   localhost localhost.localdomain localhost4 localhost4.localdomain4
::1         localhost localhost.localdomain localhost6 localhost6.localdomain6

10.0.0.11 elasticsearch-01
10.0.0.12 elasticsearch-02
10.0.0.13 elasticsearch-03

# 重启 logstash
[root@log-client ~]# systemctl restart logstash
5.8.3 查看 Kafka 中的 topic
注意:本示例中 Kafka、zookeeper、elasticsearch 集群均安装在(10.0.0.11、10.0.0.12、10.0.0.13)三台主机上
[root@elasticsearch-01 kafka]# pwd
/usr/local/kafka
[root@elasticsearch-01 kafka]# ./bin/kafka-topics.sh --list --zookeeper localhost:2181
OpenJDK 64-Bit Server VM warning: If the number of processors is expected to increase from one, then you should configure the number of parallel GC threads appropriately using -XX:ParallelGCThreads=N
__consumer_offsets
system-log # 成功写入日志
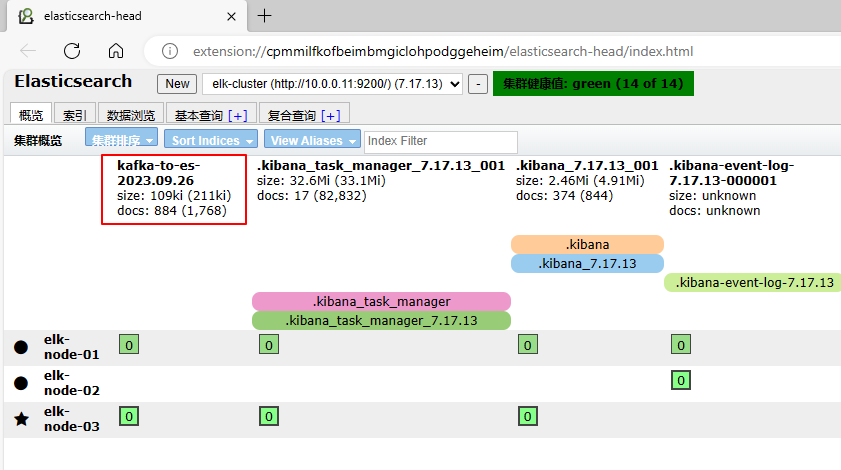
5.8.4 读取 Kafka 中的日志写入 Elasticsearch
[root@logstash ~]# cat /etc/logstash/conf.d/kafka-to-es.conf
input {
  kafka {
    bootstrap_servers => "10.0.0.11:9092"
    topics => "system-log"
    consumer_threads => 1
  }
}

output {
  elasticsearch {
    hosts => ["10.0.0.11:9200"]
    index => "kafka-to-es-%{+YYYY.MM.dd}"
  }
}

[root@logstash ~]# systemctl restart logstash.service
5.9 使用 filebeat 收集日志
要在 Filebeat 中使用 conf.d/* 的方式导入配置文件,通常你需要按照以下步骤进行配置:
创建一个存放额外配置文件的目录,通常命名为
conf.d,并将你的额外配置文件放置在该目录中。这些配置文件可以包含不同输入、过滤器和输出的定义。确保 Filebeat 配置文件中包含一个配置项,告诉 Filebeat 去加载
conf.d目录下的配置文件。通常,你可以使用filebeat.config.modules来配置额外配置文件的路径,如下所示:
filebeat.config.modules:
  path: ${path.config}/modules.d/*.yml
  reload.enabled: false

filebeat.config.inputs:
  enabled: true
  path: ${path.config}/conf.d/*.yml  # 这里指定额外配置文件的路径
- 确保你的额外配置文件(位于
conf.d目录中)具有正确的格式和语法。这些配置文件可以包含输入、过滤器和输出的定义,类似于主配置文件。
以下是一个示例额外配置文件的内容(conf.d/my-custom-input.yml):
filebeat.inputs:
  - type: log
    paths:
      - /var/log/myapp/*.log
    fields:
      log_type: myapp-log
- 保存主配置文件和额外配置文件,并重新启动 Filebeat 服务以使更改生效:
sudo systemctl restart filebeat
这样,Filebeat 将加载主配置文件以及位于 conf.d 目录下的所有额外配置文件,并根据这些配置文件来处理日志数据。
请根据你的实际需求和环境对配置进行自定义,并确保配置文件的正确性和一致性。
https://www.elastic.co/guide/en/beats/filebeat/7.17/setup-repositories.html#_yum
5.9.1 在 log-client 安装 filebeat
[root@log-client ~]# sudo rpm --import https://packages.elastic.co/GPG-KEY-elasticsearch

[root@log-client ~]#
[root@log-client ~]# cat > /etc/yum.repos.d/filebeat-7.repo << EOF
> [elastic-7.x]
> name=Elastic repository for 7.x packages
> baseurl=https://artifacts.elastic.co/packages/7.x/yum
> gpgcheck=1
> gpgkey=https://artifacts.elastic.co/GPG-KEY-elasticsearch
> enabled=1
> autorefresh=1
> type=rpm-md
> EOF
[root@log-client ~]# sudo yum install filebeat
5.9.2 收集系统日志
5.9.2.1 收集单个系统日志,写入 kafka
[root@log-client ~]# cat /etc/filebeat/filebeat.yml
lebeat.config.modules:
  path: ${path.config}/modules.d/*.yml
  reload.enabled: true

filebeat.inputs:
  - type: log
    enabled: true
    paths:
      - /var/log/*.log
      - /var/log/messages
    exclude_lines: ["^DBG"]
    exclude_files: [".gz$"]
    fields_under_root: true
    fields:
      document_type: "system-log"

output.kafka:
  hosts: ["10.0.0.11:9092", "10.0.0.12:9092", "10.0.0.13:9092"]
  topic: "system-log-filebeat"
  partition.round_robin:
    reachable_only: true
  required_acks: 1
  compression: gzip
  max_message_bytes: 1000000
[root@log-client ~]# systemctl restart filebeat
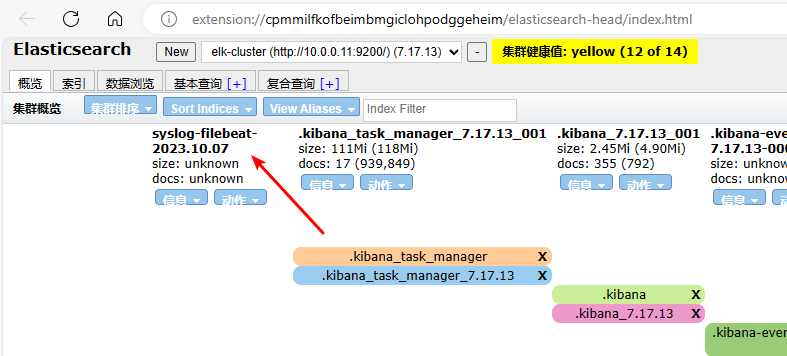
2.9.2.2 在 kafka 中查看 topic
[root@elasticsearch-01 elasticsearch]# /usr/local/src/kafka_2.12-2.1.0/bin/kafka-topics.sh  --list --zookeeper localhost:2181 |grep filebeat
...
system-log-filebeat
2.9.2.3 使用 logstash 将 kafka 中的日志写入 elasticsearch
[root@logstash ~]# cat /etc/logstash/conf.d/kafka-to-es.conf
input {
  kafka {
    bootstrap_servers => "10.0.0.11:9092"
    topics => "system-log-filebeat"
    consumer_threads => 1
  }
}

output {
  elasticsearch {
    hosts => ["10.0.0.11:9200"]
    index => "syslog-filebeat-%{+YYYY.MM.dd}"
  }
}
[root@logstash ~]# systemctl restart logstash
FAQ
elk 中用 redis 和用 kafka 缓存日志有何区别
在ELK(Elasticsearch, Logstash, Kibana)堆栈中,使用Redis和Kafka来缓存日志有一些区别,它们分别适用于不同的使用情境和需求:
Redis缓存日志:
- Redis是一个内存数据库,通常用于缓存和高速读写操作。在ELK中,Redis通常用于缓存日志事件,以便在Logstash和Elasticsearch之间提供快速的缓冲机制。
- 使用Redis缓存日志的优点包括高速的写入和读取速度,以及简单的设置和配置。
- 缺点是Redis的存储容量受限于内存大小,可能需要更多的内存来缓存大量的日志事件。此外,Redis不是一个专门设计用于处理日志流的工具,因此在某些情况下可能需要额外的定制。
Kafka缓存日志:
- Kafka是一个分布式消息队列,通常用于高吞吐量的数据流处理。在ELK中,Kafka用于接收、缓存和分发日志事件,充当了一个持久性的数据缓冲层。
- 使用Kafka的优点包括能够处理大规模的数据流,提供数据持久性,以及具备高可用性和可伸缩性。
- 缺点是Kafka的配置和维护可能相对复杂,因为它是一个分布式系统。此外,它不像Redis那样适用于低延迟要求的场景。
关键区别:
- Redis主要用于瞬时性缓存,适用于需要快速读写操作的场景,但不适用于长期存储。它通常用于解决Logstash和Elasticsearch之间的速度不匹配问题。
- Kafka更适合于数据流处理,能够缓存大量数据并确保持久性。它允许多个消费者并行处理数据,因此适用于大规模、高吞吐量的日志处理。
通常情况下,选择使用Redis还是Kafka取决于你的日志处理需求和架构。如果你需要一个简单的缓冲层来解决速度不匹配的问题,Redis可能是更合适的选择。如果你需要处理大量的日志数据,需要持久性和分布式处理能力,那么Kafka可能更适合。此外,还可以考虑将它们结合使用,使用Redis进行短期缓存,然后将日志事件写入Kafka以进行长期存储和分发。
filebeat 和 logstash 的区别
Filebeat和Logstash都是用于日志收集和传输的工具,但它们有一些关键区别,主要涉及到它们的用途、特性和性能:
用途:
- Filebeat:Filebeat是轻量级的数据收集器,专注于从文件和日志位置收集数据并将其发送到目标位置,通常是Elasticsearch或Logstash。它主要用于日志文件的收集和转发。
- Logstash:Logstash是一个强大的数据处理引擎,具有数据转换、过滤和丰富功能。它可以用于数据的采集、转换、丰富、过滤和输出。虽然它也可以用于日志收集,但其功能更丰富,可以处理多种数据源和格式。
处理和转换:
- Filebeat:Filebeat通常不对数据进行处理或转换,它负责将原始数据发送到目标位置。它可以对数据进行简单的筛选,但不具备复杂的数据处理功能。
- Logstash:Logstash具有强大的数据处理能力,可以对数据进行复杂的转换、过滤、丰富和标准化操作。这使得Logstash在需要对数据进行复杂处理的情况下非常有用。
插件和输出:
- Filebeat:Filebeat的主要目标是将数据发送到Elasticsearch、Logstash或其他目标。它的输出选项相对较少,主要用于数据的传输。
- Logstash:Logstash有丰富的插件和输出选项,可以将数据发送到多种目标,包括Elasticsearch、Kafka、Redis、数据库等,同时可以使用各种输入插件来接收数据源。
轻量性和性能:
- Filebeat:Filebeat设计为轻量级,占用较少的系统资源,适用于部署在资源受限的环境中。它适合快速传输日志数据。
- Logstash:Logstash相对较重,需要更多的系统资源,特别是在进行大规模数据处理时。它适合处理复杂的数据处理任务。
部署场景:
- Filebeat适用于简单的日志传输和快速的日志收集场景,特别是在需要轻量级解决方案的情况下。
- Logstash适用于需要进行数据处理、转换和丰富操作的场景,尤其是当需要处理多种数据源或数据格式时。
通常情况下,你可以根据具体的需求来选择使用Filebeat、Logstash,或者它们的组合,以构建适合你的日志收集和处理架构。要根据特定需求进行选择,以确保系统的效率和性能。